Distill enables traders, developers, and asset owners to make informed decisions by simulating planning scenarios with AI-native, probabilistic analysis. This is the first post in a multi-part series covering Distill’s approach to simulations and forecasting.
Decision-making under uncertainty is difficult, even for experienced traders. Across the energy sector, future plans usually rely on basic point estimates, where all of the uncertainty and possible outcomes are compressed into a single number. In reality, the risk of any future scenario is described by the uncertainty of that scenario.
It feels comforting and easy when a vendor provides a point estimate like
“ERCOT utility scale solar capacity will hit 60GW by the end of 2030”
Or, maybe a model predicts that
"North Hub will be about $74/MWh in July.”
It feels comforting and easy even if we know that the vendor or model is consistently under-forecasting, that the underlying assumptions may change, or that the forecast is underrepresenting the uncertainty.
Although decision-making under uncertainty is difficult, Distill helps make better decisions by providing risk-aware, probabilistic models and forecasts.
We can see the pitfalls of relying on point estimates by looking at a quick example.
Below, we see median DALMP curve in January 2026 for PHOEBE_ALL, a solar farm in West Texas. This median curve represents a simple point estimate for the DALMP during January 2026. Most of the time, point estimates or non-probabilistic forecasts will be based on some aggregate metric, like the average or the median of historical data.
However, we can see that the median dramatically under-estimates the DALMP in the extreme cases. If we plot actual DALMP curves for each day of January 2026, the median is an extremely poor predictor of the prices that occurred during Winter Storm Fern. In fact, the median is so unreasonable that it looks dwarfed by the actual DALMP curves.
These spikes in prices are excellent examples of rare or "tail" events that pose substantial risk but are not captured in a point forecast.
With Distill's probabilistic forecasting, though, the tail events caused by Fern would not have been ignored. Instead, they would have been shown in the probabilistic forecast. Below, we see Distill's forecast for PHOEBE_ALL in January 2026. Notice that the tails of the forecast capture the extreme behavior produced by Fern.
This forecast was created using vintaged features, ERCOT's Transmission Service Provider (TSP) load forecast, and Distill's fundamental forecasts from December 2025 for other non-load quantities. We didn't use any 2026 actuals within our modeling process, so this forecast results from the exact methodology that Distill uses for forward-looking forecasts.
Without a probabilistic forecast, the uncertainty was compressed into the single point estimate, represented by the median DALMP curve. However, with a probabilistic forecast, the uncertainty is represented by the distribution of possible outcomes. Distill's forecasts make it easier to operate under uncertainty.
While the PHOEBE_ALL example seems specific, the differences between point estimates and probabilistic forecasts appear in nearly every forward-looking task in the energy sector. We routinely try to predict the answers to questions like these:
- How quickly will ERCOT data center capacity expand over the next 3 years?
- What Western market expansions will be most impactful in the next 5 years?
- How will federal subsidies impact utility scale battery deployment over the next 10 years?
These questions are essential to the success and profitability of developers and traders, but their answers are difficult to come by. While point estimates may instill a sense of confidence, they are misleading and obscure the uncertainty about the answer.
Suppose you're a private equity firm or a trading desk taking an equity position in an asset to structure trades around. All things considered, you need merchant revenue from the asset to exceed $1,000,000 over the next 10 years.
How do you know if it will or not?
There’s many factors that play into profitability, including expected power demand, projected solar saturation, innovations in solar technologies, changes to market rules, future weather patterns, tax credit adjustments, and more. A slight tweak in any of these assumptions can drastically change the profitability of your project.
However, if you go to a traditional consulting firm and ask them how much your asset will make, they might come back with the following answer:
“Your asset will make $1.2m over the next 10 years.”
You should be skeptical. That sounds like a point estimate that does not account for the uncertainty driving the profitability of your investment.
A risk aware forecast would give you much more information. It might sound something like,
“On average, your asset will make $1.2m over the next 10 years, with 95% of scenarios between $900k and $1.5m.”
You could visualize it in a distribution like this:
Creating distributions like this is possible by running many different simulations of your project under different assumptions. For instance, in each simulation, we can slightly tweak an assumption about load growth and observe how your project performs under the new assumption. We call this process “sampling,” and take a sample of potential underlying assumptions for each simulation.
By doing this, we can account for risk.
Accounting for risk is extremely important because two very different risk exposures may yield the same average returns. For instance, look at the two distributions below. On average, they both describe projects yielding $1.2m over 10 years. However, in one, nearly 25% of the scenarios are underwater, while, in the other, only 5% of the scenarios are underwater.
Risk-aware forecasts, like the ones above, are how Distill makes it easier to operate under uncertainty. We give you a full view of many scenarios with different underlying assumptions. We accomplish this by running hundreds of optimal powerflow simulations with different sets of factors, like load growth, capacity expansion, solar capacity, wind capacity, battery capacity, and more.
For instance, we have forecasts that reflect different probable instances of load growth over the next decade. The plots below are real forecasts that you could use to simulate the revenue of a new asset.
Click on the buttons to draw samples from the forecasts.
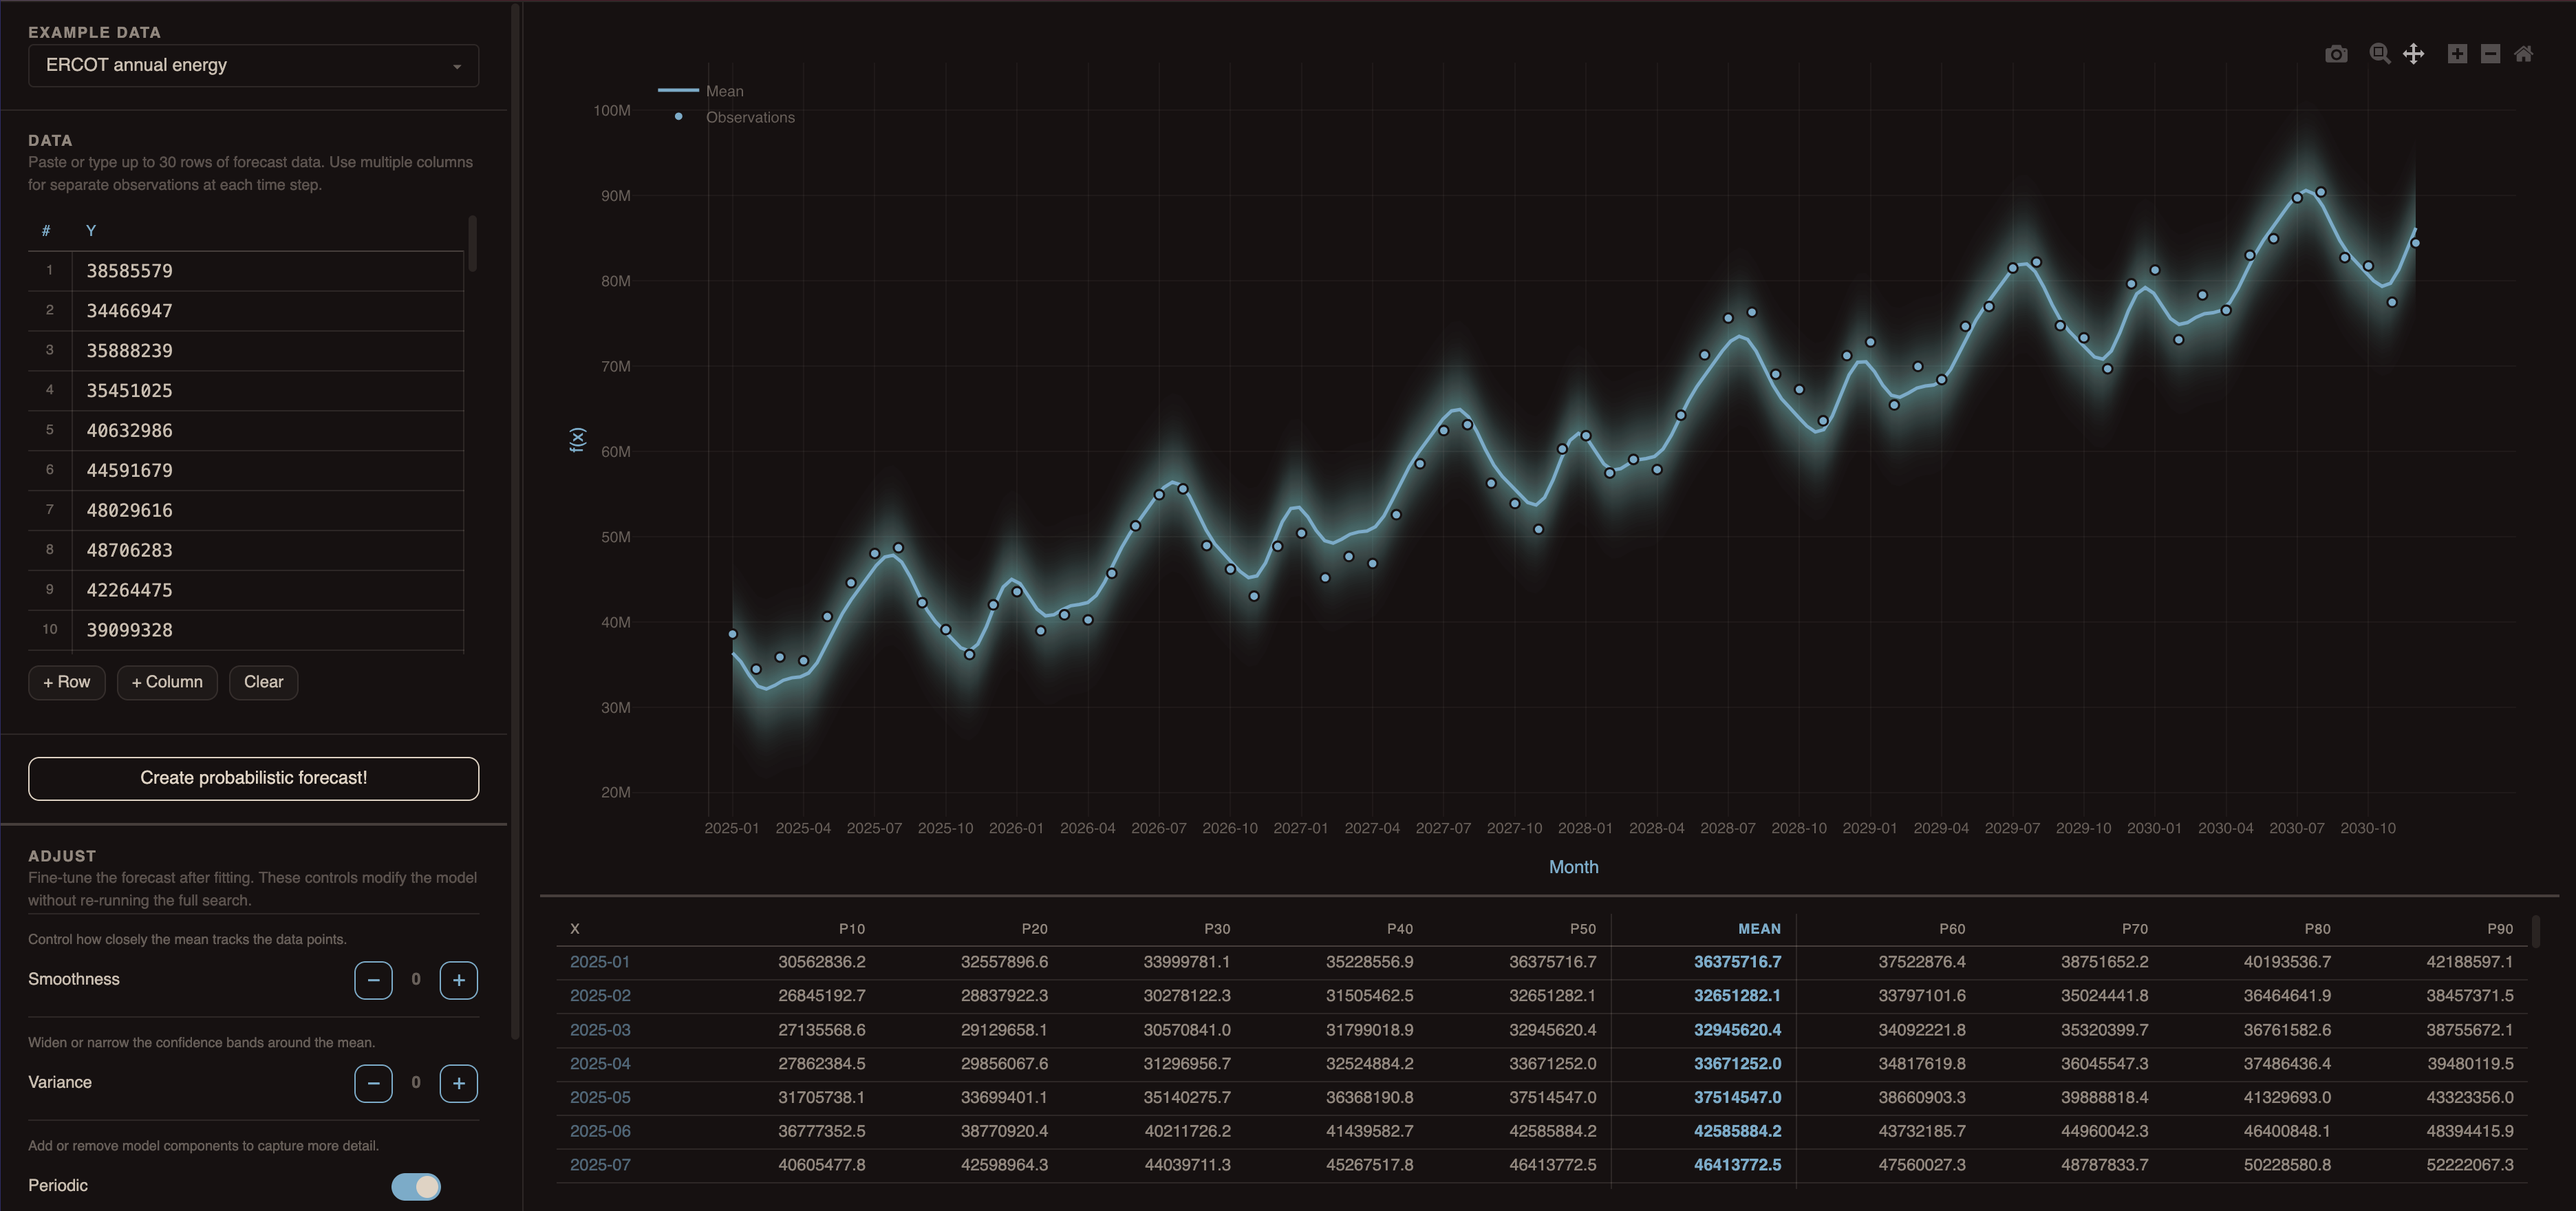
Distill’s Probabilistic Data Studio allows you to explore and adjust probabilistic forecasts like the one above. You can choose from examples like ERCOT’s annual energy forecast or HB_NORTH’s LMPs, or you can input custom data. After training the forecast, you can tune the shape, uncertainty, and complexity. All of the outputs are inherently probabilistic by design.
The Decision-Making Problem
If we have forecasts with uncertainty, how do we turn those predictions into decisions? Specific details are the topic of a future post, but you can think about these questions in the meantime:
- How would my business be impacted in the extreme cases shown in the forecasts?
- How sensitive is my business to the outcomes in each direction (e.g., an under forecast would make the company slightly more profitable but an over forecast would bankrupt us)?
- How can that sensitivity be tested?
If you're interested in learning more about Distill's probabilistic forecasting, please sign up for access.